This site uses cookies to improve your experience. To help us insure we adhere to various privacy regulations, please select your country/region of residence. If you do not select a country, we will assume you are from the United States. Select your Cookie Settings or view our Privacy Policy and Terms of Use.
Cookie Settings
Cookies and similar technologies are used on this website for proper function of the website, for tracking performance analytics and for marketing purposes. We and some of our third-party providers may use cookie data for various purposes. Please review the cookie settings below and choose your preference.
Used for the proper function of the website
Used for monitoring website traffic and interactions
Cookie Settings
Cookies and similar technologies are used on this website for proper function of the website, for tracking performance analytics and for marketing purposes. We and some of our third-party providers may use cookie data for various purposes. Please review the cookie settings below and choose your preference.
Strictly Necessary: Used for the proper function of the website
Performance/Analytics: Used for monitoring website traffic and interactions
I will discuss general tools and credible sources of information that a valuation professional can use for the analysis. Access to credible sources of information such as SEC EDGAR database , Treasury.gov , OECD GDP Forecast , Mergent Online, S&P Capital IQ, Hoovers, ValueLine, Yahoo Finance , MarketWatch , and Damodaran Online.
Calculate cost of debt, cost of equity, and weighted average cost of capital (WACC). For interest income and expense, I prefer to state them as percentages of the average debt balance of the last two years. It is a good practice to verify the intended debt-vs-total-capital balance post-transaction when possible.
It’s integral to ensuring that the sale benefits all stakeholders and should be one of your priorities before advertising it to potential buyers. It’s a delicate balancing act, as inaccurate valuations have polarizing consequences. However, company valuation isn’t as simple as slapping a price on your business.
When Mike called me about the opportunity to join Conversant, he emphasised the firm’s long-term, buy-and-hold strategy, akin to private equity. There’s been a reopening in capital markets. It’s been busy. There’s a very healthy dialogue at all times at both the portfolio-level and the position-level.
Once the terms are agreed upon, the acquisition is financed through a combination of debt and equity from the PE firm, as with a typical transaction. This results in the target company receiving a potentially very different capital structure than they previously had, typically with higher debt levels. Pitchbook).
Once the terms are agreed upon, the acquisition is financed through a combination of debt and equity from the PE firm , as with a typical transaction. This results in the target company receiving a potentially very different capital structure than they previously had, typically with higher debt levels. Pitchbook).
A discussion of the target’s financials typically starts with the P/L or Income Statement, followed by the Balance Sheet, and then the Cash Flow Statement. In discussing the P/L, I typically comment on: Revenue - by lines of business, whether they appear to be gross or net, and if there is any meaningful customer concentration.
A profit and loss (P&L) statement, sometimes called as an income statement, is a financial report that provides investors and outsiders with a financial overview of a company. The P&L outcome plotted on a trendline assists investors in understanding the organization’s performance over time.
Our research team averaged the information using data from our Sica | Fletcher index, which monitors approximately 70% of insurance sector transactions. However, the brokerage's tech stack now handles many of these job functions, which significantly improves the bottom line and increases profitability. Streamlined Operations.
It’s a balance where numbers meet intuition, and neither aspect should be ignored. Purposes of Valuation Before diving into the nuts and bolts of valuation, it’s crucial to understand its purposes. This includes macroeconomic trends, industry-specific data, and company-specific financial information.
Sandler O’Neill’s Weekly M&A Trends: The S&P 500 had its best week since early June The S&P 500 rose by 2.2% In 3Q12, the S&P 500 has risen by 5.6% s $2 billion offering of its shares in the A.I.A. Corporate debt underwriting volumes of $98 billion nearly tripled from the prior week.
Sica | Fletcher’s own SF Index , for example, tracks the top 40 active buyers in the insurance space, providing up-to-date information on EBITDA multiples and other sector-specific deal information. In addition, third-party M&A institutions like S&P Global Data or Statista can provide more generalized data.
The S&P 500 has recently traded near 4800, close to its record at the end of 2021. About the only new entrant to the public markets has been KLDiscovery, a provider of e-discovery, information governance and data recovery services, which went public via a special purpose acquisition company (SPAC) transaction in 2020.
Sandler O’Neill’s Weekly M&A Trends: The S&P 500 declined for the second consecutive week but ended positive for the month The S&P 500 declined by 0.3% In 3Q12, the S&P 500 has risen by 3.3% Corporate debt underwriting volumes of $30.8 in the week. Announced M&A volumes of $39.8
In other words, you profit based on the company’s dividend s and the potential increases in its stock price over time. Also, the Terminal Value is normally based on a P / E multiple or a Net Income Growth Rate. In our forecast, Cash rises too much, and Debt / EBITDA goes from 5.0x
Sandler O’Neill’s Weekly M&A Trends: Equity markets pulled back modestly on lighter trading volume The S&P 500 declined by 0.4% In 3Q12, the S&P 500 has risen by 7.2% s $102 million offering highlighting the week, returning over 40% on its first day of trading. in the week. Average daily U.S.
Sandler O’Neill’s Weekly M&A Trends: Equity markets declined for the second week in a row The S&P 500 declined by 1.3% In 3Q12, the S&P 500 rose by 5.8% Both announced and completed M&A improved but remain light while equity and debt underwriting were solid on the week Equity underwriting volumes of $19.4
Sandler O’Neill’s Weekly M&A Trends: The S&P 500 declined after six consecutive weeks of gains The S&P 500 declined by 0.5% In 3Q12, the S&P 500 has risen by 3.6% Corporate debt underwriting volumes of $33.5 in the week and the Russell 2000 growth index declined by 1.3% in the week.
They have enormous amounts of dry powder that they must deploy and continue to have access to very inexpensive debt. We thought that the best way to highlight the current trends in the marketplace would be to show the data as initially reported by S&P for each quarter.
In addition to the high cost of debt interfering with their bottom line, they also have to contend with a buyer pool that’s larger than ever before , with 50+ buyers in the current pool where there used to be ~5. Sellers are remaining patient and working with M&A advisosr to identify areas of opportunity.
Other times, they are hoping to use their share of the sale to alleviate personal debt. Manageable Debt. Stay informed about industry trends and regulatory changes. seller's discretionary earnings, discounted cash flow), they are so rarely used in insurance M&A that we do not include them here. Let’s Talk.
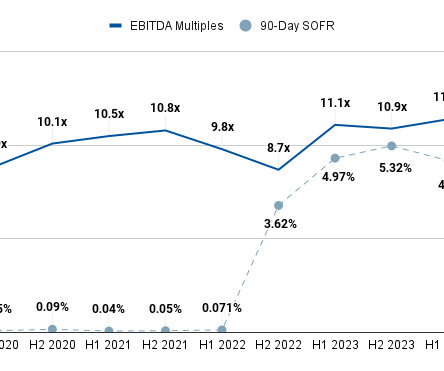
EBITDA Multiples for Insurance Agencies, 2018-2024 (Projected) M&A Deal Volume for Insurance Agencies, 2018-2024 (Projected) *S&P Global Data taken from ,,, “Insurance Brokers and Servicers Sector View 2024” The most important news this data offers is that insurance M&A is not actually in the tailspin that many “experts” claim it to be.
This tool proves indispensable for students and their families in making informed decisions regarding loan affordability, repayment terms, and budgeting for educational expenses. However, it’s important to note the limitations of educational loan calculators. How to Calculate?
Partially, it’s an issue of accessibility: Everyone understands what happens to the stock price if a company beats earnings… …but few people understand what it means if a company is set to violate a debt covenant on page 214 of its credit agreement. the appropriate debt vs. equity mix, and additional capital needs over the next few quarters.
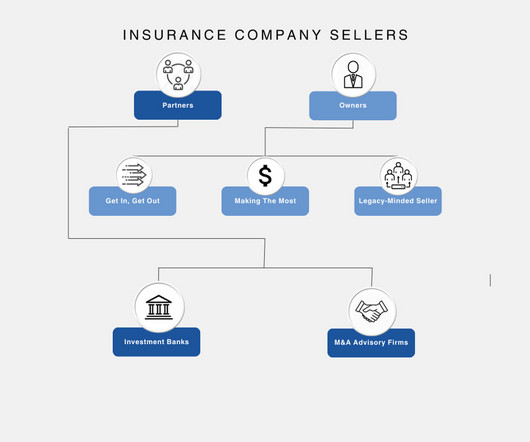
personal debt, business/legal liabilities, time-sensitive investment opportunities) may prompt owners to sell quickly. M&A Advisory Firms vs. Investment Banks We should emphasize that the comparison information above is generalized , and may not apply to all such firms or banks. Financial Need. Urgent financial requirements (e.g.,
Equities and the S&P 500 At the onset of each new year, like clockwork, we’re asked for our near-term view. benchmark equity index, the S&P 500. Consequently, by the end of July 2023, the S&P was up more than 20% for the year. This year was no different.
The table of contents below offers quick links for readers seeking specific information in later sections. PE firms rely on leveraged buyouts (LBOs) for the lion's share of their deals, which often involve using the acquired company’s assets as collateral to insure the loan used to purchase it.
Since H2 2022, industries across the board (including insurance) have seen declines in deal volume as prospective buyers have withheld their funds for more favorable conditions in which the cost of debt is not so high. Consult data sources like S&P Global data to get an idea of a firm’s activity within the industry.
Metals & Mining Investment Banking Definition: In metals & mining investment banking, professionals advise companies that find, produce, and distribute base metals, bulk commodities, and precious metals on debt and equity issuances and mergers and acquisitions. What Do You Do as an Analyst or Associate in the Group?
This includes examining the company’s financials, contracts, and other documents that will help them to determine the value of the business. Having the right documents in place, such as an operating agreement, P&Ls, meeting minutes, and resolutions, can make the process of selling the business much smoother and easier.
You’ll have a roadmap to make informed decisions and maximize your investment returns by the end. Assessing the Business’s Financial Health The financial health of a business is one of the most reliable indicators of its potential as an investment. Debt-to-Equity Ratio: A ratio below 2:1 is considered manageable.
David Dart: Well, well, there’s a couple of really important elements that we’re driving here at Caliber Number one, our technician apprentice program. So that’s a really critically important talent development function that we have. Cole Strandberg: Let’s do both. I think that’s insanely important.
I know I can look at a P and L right off the bat and highlight a few things that I just stick out because weve done it both on the M and A side and the operational side. S Corp as an asset sale. Some of them just want the information and then they, I think they get scared to make the call or whatever you want to call it.
We organize all of the trending information in your field so you don't have to. Join 38,000+ users and stay up to date on the latest articles your peers are reading.
You know about us, now we want to get to know you!
Let's personalize your content
Let's get even more personalized
We recognize your account from another site in our network, please click 'Send Email' below to continue with verifying your account and setting a password.


Let's personalize your content