This site uses cookies to improve your experience. To help us insure we adhere to various privacy regulations, please select your country/region of residence. If you do not select a country, we will assume you are from the United States. Select your Cookie Settings or view our Privacy Policy and Terms of Use.
Cookie Settings
Cookies and similar technologies are used on this website for proper function of the website, for tracking performance analytics and for marketing purposes. We and some of our third-party providers may use cookie data for various purposes. Please review the cookie settings below and choose your preference.
Used for the proper function of the website
Used for monitoring website traffic and interactions
Cookie Settings
Cookies and similar technologies are used on this website for proper function of the website, for tracking performance analytics and for marketing purposes. We and some of our third-party providers may use cookie data for various purposes. Please review the cookie settings below and choose your preference.
Strictly Necessary: Used for the proper function of the website
Performance/Analytics: Used for monitoring website traffic and interactions
The following report details insurance brokerage M&A multiple averages for H1 2024. Our research team averaged the information using data from our Sica | Fletcher index, which monitors approximately 70% of insurance sector transactions. Because several kinds of insurance are legally required (e.g., Streamlined Operations.
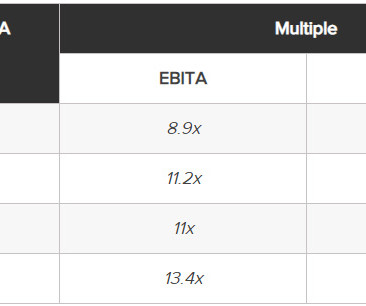
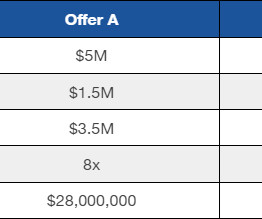
This article breaks down the question, “how much is my insurance agency worth” in further detail, but the table below provides a surface-level overview based on varying degrees of revenue and operating expense: How Much Is My Insurance Agency Worth: A Breakdown Answering the question, “how much is my insurance agency worth?”
Quite a few articles already detail the process of “how” to sell an insurance agency (you can read our article on that subject here ), but very few get to the bare bones of “why.” If you’re asking, “ should I sell my insurance agency,” the three big questions you must answer first are: Why Do I Want To Sell?
The 2024 insurance M&A market has changed substantially from just a few years ago, with potentially staggering implications for the future of insurance M&A transactions. Insurance M&A Transactions in 2024 The insurance M&A transactions we have observed thus far in 2024 indicate larger trends in the sector.
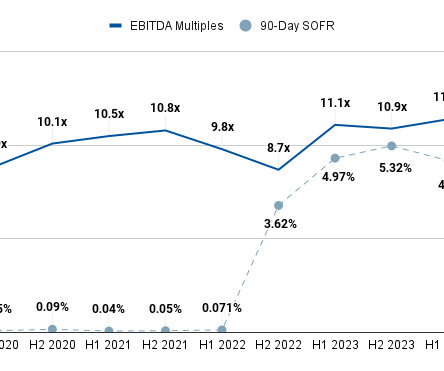
Having advised on a record number of insurance agency M&A transactions, we have used our unusually large dataset in tandem with access to third-party M&A databases to provide up-to-date averages of EBITDA multiples for insurance brokerages in 2024. What Is Affecting Insurance Agency EBITDA Multiples?
The insurance M&A market in 2024 is significantly more complex now than it was 20 years ago. However, this report seeks to make sense of these qualities as a whole to provide an overview of the 2024 insurance M&A market. The table of contents below offers quick links for readers seeking specific information in later sections.
In it, we provide readers with a quick and simple overview of the current insurance brokerage M&A market , after which we discuss several macroeconomic and industry-specific factors that could drastically affect transactions in the next six months. The market is already highly competitive, but it’s also limited to what buyers can afford.
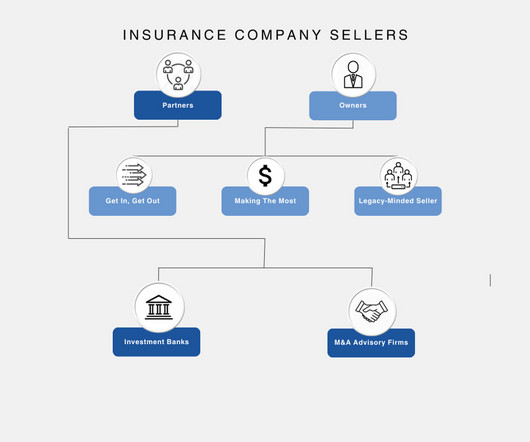
This article examines the most common types of insurance agency sellers, which we break down into two distinct categories: the owners - agency CEOs and founders - and the partners - professionals in charge of overseeing a sale to ensure the best outcome. Financial Need. Urgent financial requirements (e.g.,
What the Data Is Telling Us In our last few posts, we reported on what we perceived to be the trends in insurance agency and brokerage M&A in light of the pandemic and analyzed the reasons for these trends. They have enormous amounts of dry powder that they must deploy and continue to have access to very inexpensive debt.
Corporate structure Whether youre a C-Corp or S-Corp can affect taxes at sale. Optimize Working Capital (One Year Ahead) What It Is: Net Working Capital (NWC) is Current assets minus current liabilities (A/R + Inventory A/P + Accrued Expenses), excluding cash, which you keep (in a typical cash-free, debt-free transaction).
To be fair, in some industries – like commercial banks and insurance within FIG – the DDM is a core valuation methodology. In other words, you profit based on the company’s dividend s and the potential increases in its stock price over time. But outside of those, its status is murkier.
Sandler O’Neill’s Weekly M&A Trends: The S&P 500 had its best week since early June The S&P 500 rose by 2.2% In 3Q12, the S&P 500 has risen by 5.6% s $2 billion offering of its shares in the A.I.A. Corporate debt underwriting volumes of $98 billion nearly tripled from the prior week.
Sandler O’Neill’s Weekly M&A Trends: The S&P 500 declined for the second consecutive week but ended positive for the month The S&P 500 declined by 0.3% In 3Q12, the S&P 500 has risen by 3.3% Corporate debt underwriting volumes of $30.8 in the week. Announced M&A volumes of $39.8
Sandler O’Neill’s Weekly M&A Trends: Equity markets pulled back modestly on lighter trading volume The S&P 500 declined by 0.4% In 3Q12, the S&P 500 has risen by 7.2% s $102 million offering highlighting the week, returning over 40% on its first day of trading. in the week. Average daily U.S.
Sandler O’Neill’s Weekly M&A Trends: Equity markets declined for the second week in a row The S&P 500 declined by 1.3% In 3Q12, the S&P 500 rose by 5.8% Both announced and completed M&A improved but remain light while equity and debt underwriting were solid on the week Equity underwriting volumes of $19.4
Sandler O’Neill’s Weekly M&A Trends: The S&P 500 declined after six consecutive weeks of gains The S&P 500 declined by 0.5% In 3Q12, the S&P 500 has risen by 3.6% Corporate debt underwriting volumes of $33.5 in the week and the Russell 2000 growth index declined by 1.3% in the week.
This includes examining the company’s financials, contracts, and other documents that will help them to determine the value of the business. Having the right documents in place, such as an operating agreement, P&Ls, meeting minutes, and resolutions, can make the process of selling the business much smoother and easier.
As we have reported throughout the year, the M&A market for insurance brokers remained at peak, pre-pandemic levels despite all of the public health, political, social, and economic dislocations. S&P reported that the number of insurance brokerage transactions closed in 2020 slightly exceeded those in 2019.
David Dart: Well, well, there’s a couple of really important elements that we’re driving here at Caliber Number one, our technician apprentice program. So that’s a really critically important talent development function that we have. Cole Strandberg: Let’s do both. I think that’s insanely important.
I know I can look at a P and L right off the bat and highlight a few things that I just stick out because weve done it both on the M and A side and the operational side. S Corp as an asset sale. Its just like, you know, I got a brother thats in the insurance world. Youll bring in an equity partner, bring on some debt.
We organize all of the trending information in your field so you don't have to. Join 38,000+ users and stay up to date on the latest articles your peers are reading.
You know about us, now we want to get to know you!
Let's personalize your content
Let's get even more personalized
We recognize your account from another site in our network, please click 'Send Email' below to continue with verifying your account and setting a password.


Let's personalize your content