This site uses cookies to improve your experience. To help us insure we adhere to various privacy regulations, please select your country/region of residence. If you do not select a country, we will assume you are from the United States. Select your Cookie Settings or view our Privacy Policy and Terms of Use.
Cookie Settings
Cookies and similar technologies are used on this website for proper function of the website, for tracking performance analytics and for marketing purposes. We and some of our third-party providers may use cookie data for various purposes. Please review the cookie settings below and choose your preference.
Used for the proper function of the website
Used for monitoring website traffic and interactions
Cookie Settings
Cookies and similar technologies are used on this website for proper function of the website, for tracking performance analytics and for marketing purposes. We and some of our third-party providers may use cookie data for various purposes. Please review the cookie settings below and choose your preference.
Strictly Necessary: Used for the proper function of the website
Performance/Analytics: Used for monitoring website traffic and interactions
Inexpensive Excel-plugin simulator such as @RISK are available for download online. Access to credible sources of information such as SEC EDGAR database , Treasury.gov , OECD GDP Forecast , Mergent Online, S&P Capital IQ, Hoovers, ValueLine, Yahoo Finance , MarketWatch , and Damodaran Online.
A mature company that has been around forever (think S&P 500 companies) would be well forecasted using a 1-stage growth model (when there is only one growth rate for the entire forecast horizon). Essentially, it is a way to value a company based on cash generated from operation, taking into account all major expenses.
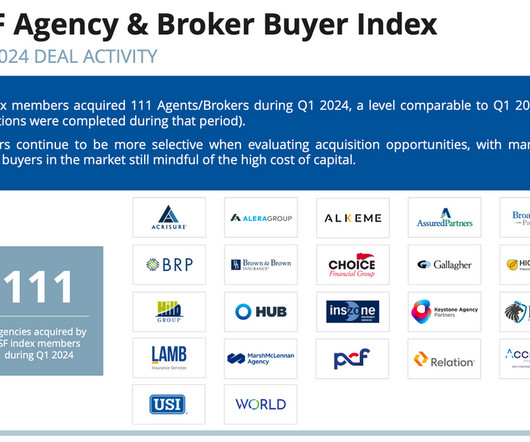
Q1 2024 Agency and Broker Buyer Index Reveals a Dynamic Landscape for Insurance M&A NEW YORK, NY - May 13, 2024 - Sica | Fletcher releases the Q1 2024 Agency & Broker Buyer Index. The shift in buyer rotation year-over-year continues to shape the dynamic insurance M&A landscape.
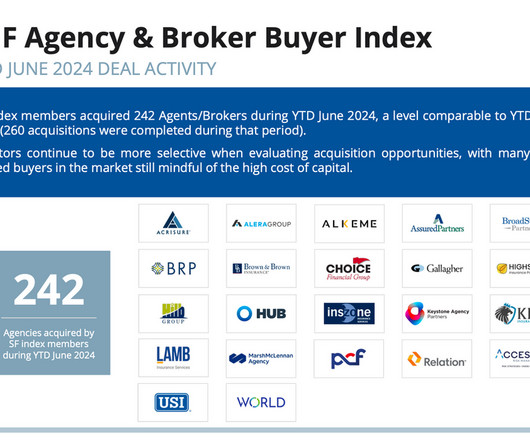
YTD June 2024 Agency and Broker Buyer Index Shows a Steady Rise for M&As NEW YORK, NY – August 6, 2024 - Sica | Fletcher releases the Q2 2024 Agency & Broker Buyer Index. Private Equity-backed buyers maintain a dominant position in M&A activity, accounting for 87% of YTD June 2024 Index transactions.
Think your customers will pay more for data visualizations in your application? Five years ago they may have. But today, dashboards and visualizations have become table stakes. Discover which features will differentiate your application and maximize the ROI of your embedded analytics. Brought to you by Logi Analytics.
YTD June 2024 Agency and Broker Buyer Index Shows a Steady Rise for M&As NEW YORK, NY – August 5, 2024 - Sica | Fletcher releases the Q2 2024 Agency & Broker Buyer Index. Private Equity-backed buyers maintain a dominant position in M&A activity, accounting for 87% of YTD June 2024 Index transactions.
On the surface, things looked rough: the Dow Jones, S&P 500, and the NASDAQ all finished the year with significant losses, with tech stocks hit particularly hard. While median EV/Revenue multiples declined from 4Q20–1Q22, they still outperformed the median public market multiple, and SaaS M&A deal volume jumped to a new record.
The Sica | Fletcher Agency & Broker Buyer Index is the most comprehensive report on insurance brokerage M&A activity in existence. The Sica | Fletcher Agency & Broker Buyer Index is the most comprehensive report on insurance brokerage M&A activity in existence. Learn more at , SicaFletcher.com.
This was despite a generally favorable market that pushed the S&P 500 up 3.6% However, the sector still lagged both the S&P 500 and NASDAQ by a wide margin over the past year. The S&P 500 is up 26.3% DOWNLOAD THE FULL REPORT HERE. and the NASDAQ up 4.0%. gain at Ubiquiti Networks.
Leveraging self-reported data from 22 prominent agent and broker acquirers, this index monitors M&A transactions representing 73% of all agency and brokerage deal activity as of YTD September 2023. The Sica | Fletcher Broker Buyer Index stands as the leading report on mergers and acquisitions within the insurance brokerage sector.
Written by a top OfficeHours Coach; Original article published on October 16, 2023 In today’s world, there is much uncertainty around public markets. However, for private equity investors, this uncertainty represents a unique opportunity to take advantage of investment opportunities in public markets.
This was despite a strong overall market that pushed the S&P 500 up 3.9% However, this performance once again lags the broader indices by a fairly wide margin, as both the S&P 500 and NASDAQ gained more than 20% over the past year. over the past three months. and the NASDAQ up 8.3% in our summer reporting period.
This loss was despite a generally positive market backdrop that saw the S&P 500 gain 3.9% This performance once again trailed the broader indices, as both the S&P 500 and the NASDAQ were up more than 20% over the past year. and the NASDAQ gain 8.3% over the corresponding time period. revenue and 5.3x
gain in the S&P 500 and the 9.1% However, this return lagged the year-over-year performance of both the S&P 500 (up 27.9%) and the NASDAQ (up 34.0%). FOCUS is proud of its commitment to the Telecom Business Services sector and we are excited about the prospects for companies in this space. a year ago to 1.2x
gain in the S&P 500 and the 2.6% gains in the S&P 500 and NASDAQ, respectively. gains in the S&P 500 and NASDAQ, respectively. OVERVIEW The FOCUS Telecom Business Services Index (TBSI) returned to positive territory this reporting period with a three-month gain of 7.7%. a year ago to 1.2x
Leveraging self-reported data from 22 of the most active acquirers in the space, the index monitors M&A transactions representing 71% of all agency and brokerage deal activity in 2023. According to S&P Global, Sica | Fletcher ranked as the #1 advisor to the insurance industry for 2017-2023 in terms of total deals advised.
This gain was made even less impressive by the fact that the S&P 500 was up 10.2% For businesses, these providers are enabling a variety of new services ranging from videoconferencing to software defined networking and security. Furthermore, it is often the middle market CSPs that point the direction for the future of the industry.
By aligning your company’s strategies and performance with their evolving priorities, you can enhance your appeal in the competitive landscape of software investments and acquisitions. SaaS founders must stay attuned to the shifting preferences of private equity (PE) investors and strategic buyers. This creates a baseline for growth.”
Even so, the TTI still handily outperformed both the S&P 500 (down 1.3%) and the NASDAQ (down 1.9%) over the same time frame.When measured over the past year, the TTI is up 32.5% gain in the S&P 500 and the 17.1% P erformance in the Broadband Access and Transport sub sector was more mixed. a year ago to 3.6x
gain in the S&P 500 and the 8.5% gain in the S&P 500 and the 35.1% The Enterprise Networking, OSS/BSS Software and Unified Communications and Contact Center sub sectors were the only three sub sectors in the TTI to notch any M&A activity. This significantly outperformed both the 6.8% gain in the NASDAQ.
This was despite a generally favorable market environment that saw the S&P 500 gain 2.1% While the S&P 500 and the NASDAQ were up 23.3% While the S&P 500 and the NASDAQ were up 23.3% These two metrics tell very different stories about M&A activity in 2024. over the past three months.
This handily outperformed both the S&P 500 (up 5.5%) and the NASDAQ (up 2.6%). year-over-year gain in the S&P 500 as well as the 37.6% This means that 2024 is shaping up oddly in terms of M&A trends. This period’s performance also increased the CSPI’s year-over-year gain to 15.8%. a year ago to 2.5x
This significantly underperformed the returns of both the S&P 500 (up 2.1%) and the NASDAQ (up 6.2%) over the corresponding time frame.When viewed over the past 12-months, the TBSI is down 3.1%. The S&P 500 is up 23.3% Once again, this compares unfavorably to the broader indices. revenue and 10.5x revenue and 11.6x
We organize all of the trending information in your field so you don't have to. Join 38,000+ users and stay up to date on the latest articles your peers are reading.
You know about us, now we want to get to know you!
Let's personalize your content
Let's get even more personalized
We recognize your account from another site in our network, please click 'Send Email' below to continue with verifying your account and setting a password.


Let's personalize your content